Flowfinity Wireless Inc. today released a software update that allows users to manage data records and workflows geographically by rendering...
[Global] data visualization
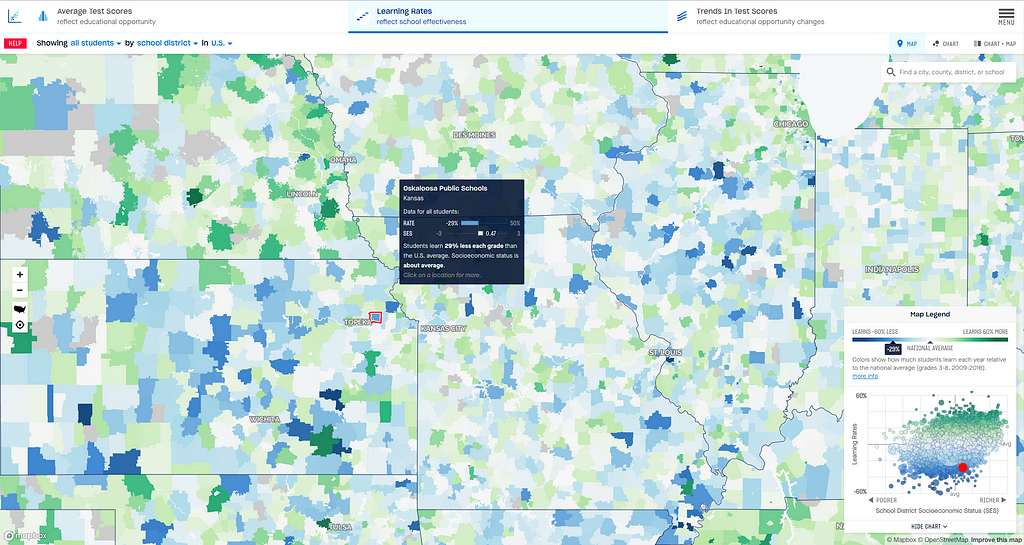
Seeing beyond test scores by visualizing the shifting landscape of education accessBy: Megan DanielsonThe Educational Opportunity Project (EOP), a research...
We like to start the new year by revisiting our articles and see what the readers liked most. 2019 was...
This post is a follow-up to the draft template for exploring movement data I wrote about in my previous post. Specifically,...
Program Gets New Members Started with GIS for Spatial Analysis, Visualization, and Data Sharing REDLANDS, Calif. — (BUSINESS WIRE) —...
Remote Sensing, Vol. 12, Pages 229: 3D Modeling of Discontinuity in the Spatial Distribution of Apartment Prices Using Voronoi Diagrams...
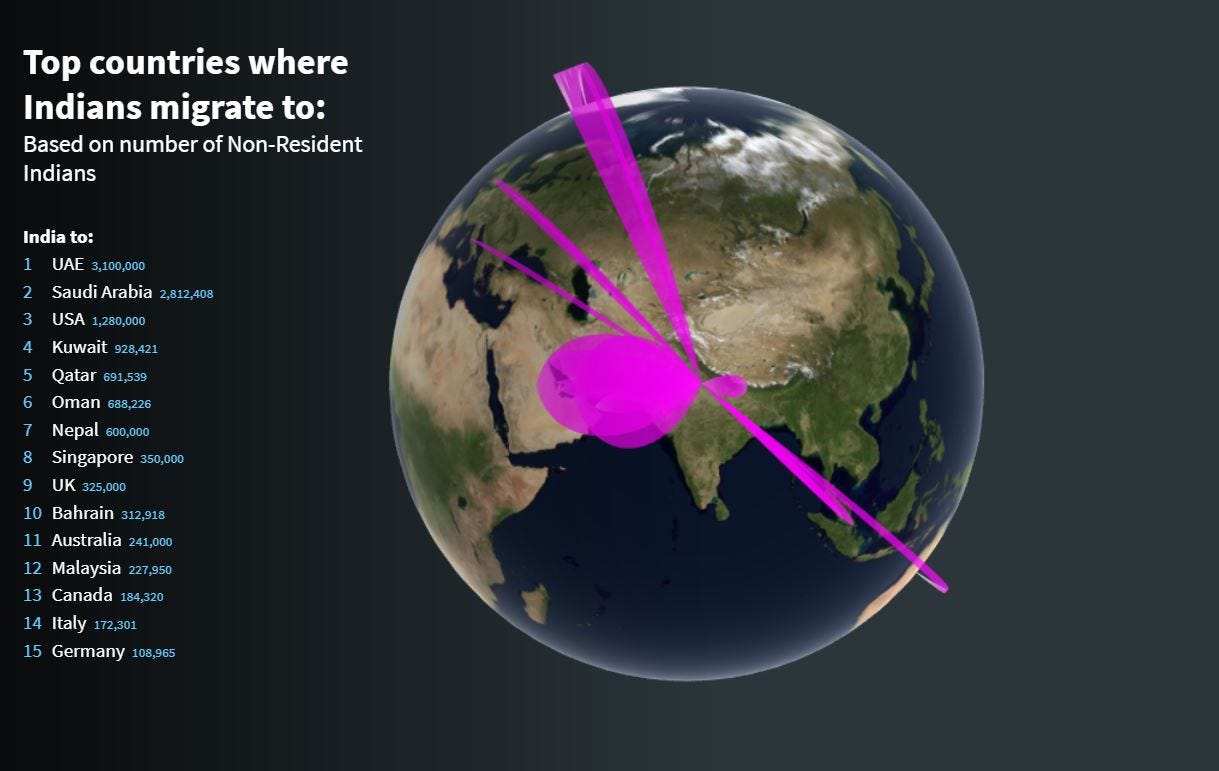
Mahfooj Khan Bio Mahfooj is a Visual Analytics Manager at Beinex. Currently he’s working as a Business Consultant in one...
The patterns of the sky and planet EarthWith this issue of Location is Personal, we’re closing the year and the run...
Spatial analysis and visualization helps us in generating insights from complex geospatial data that is easily understandable. We generate…Continue reading...
Well, the new geopaparazzi release had been requested by users that were not able to load spatialite tables that had...
Where did you travel in the last decade? This personalized map will show youGoogle probably already knows everywhere you’ve been—but...
I conducted a survey and I want to show the results reflected on an interactive map. I'd prefer if it...
Back to SchoolLocation is Personal is a monthly newsletter by Mapbox, from the desks of Lo Bénichou and Amy Lee Walton....
This four-part how-to series goes from data to analysis and visualization to layout. Buckle up!


