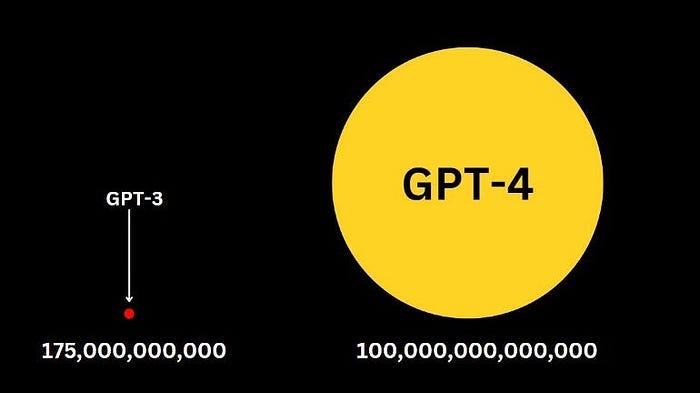
ChatGPT + Tableau: Integrate ChatGPT into Tableau via @Inoreader. https://medium.com/@araujogabe1/chatgpt-tableau-integrate-chatgpt-into-tableau-d25511a4d4a4?source=rss------data_visualization-5
Data Visualization
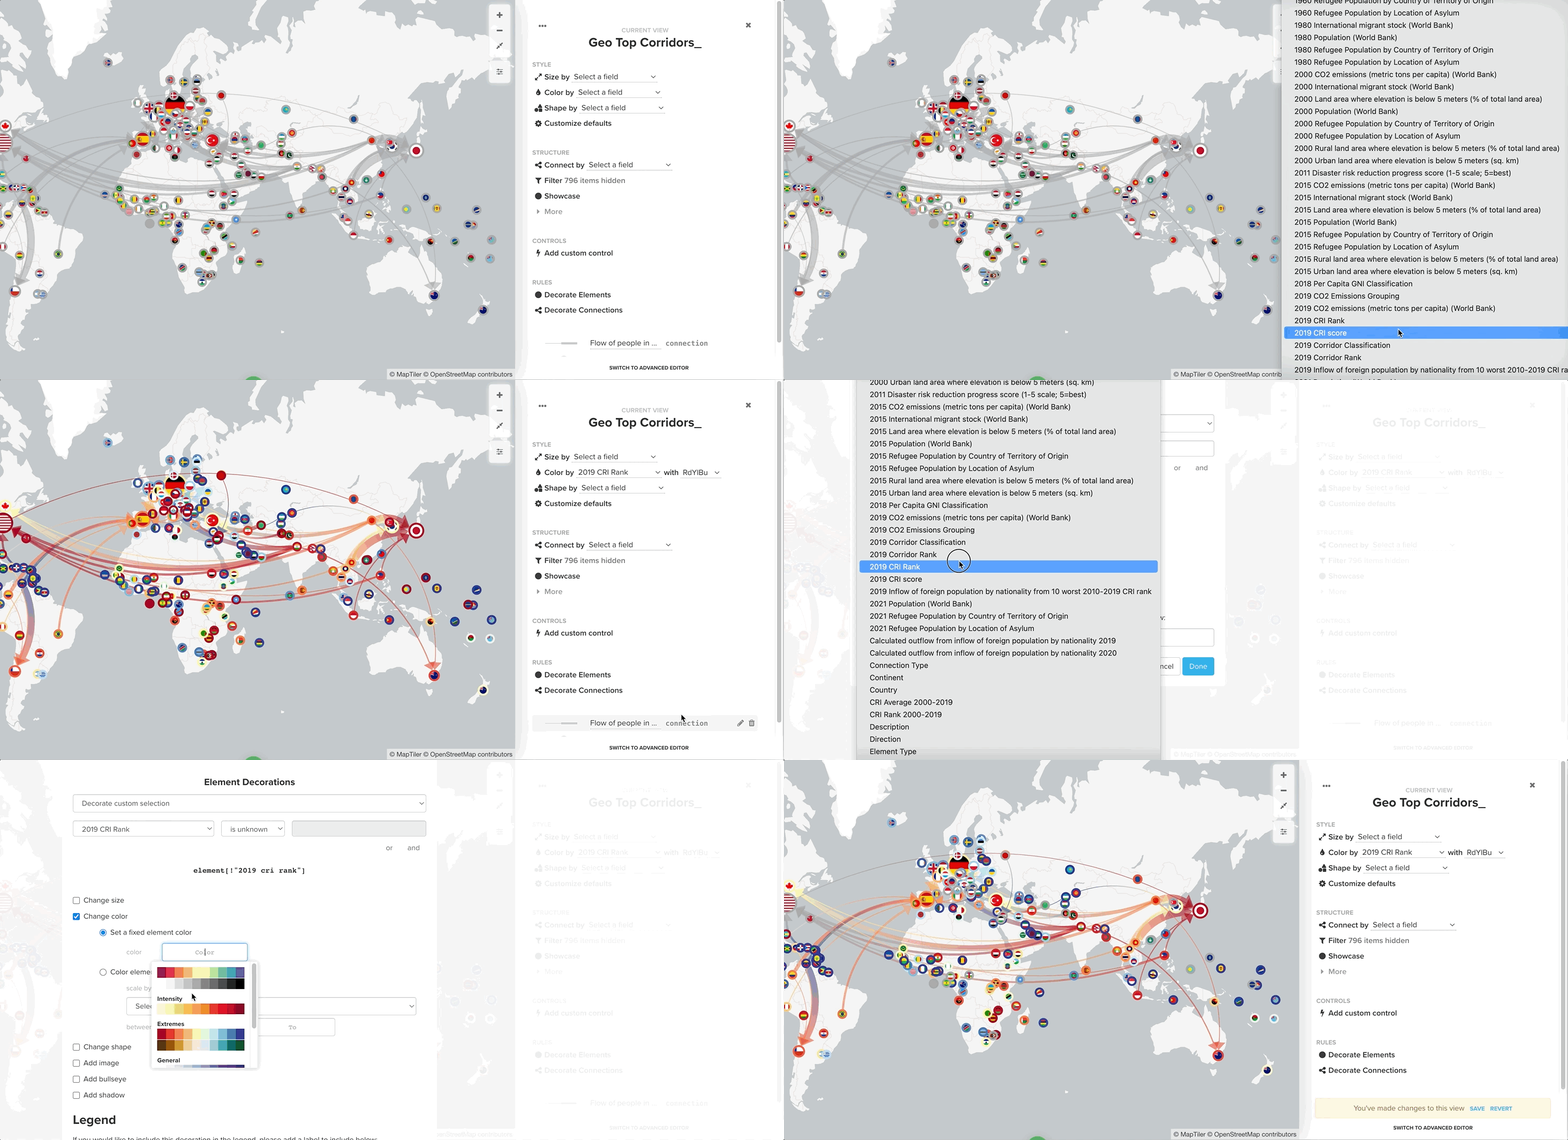
We’ve recently posted a blog on a Kumu project that explores the patterns between migration and climate change. Haven’t read...
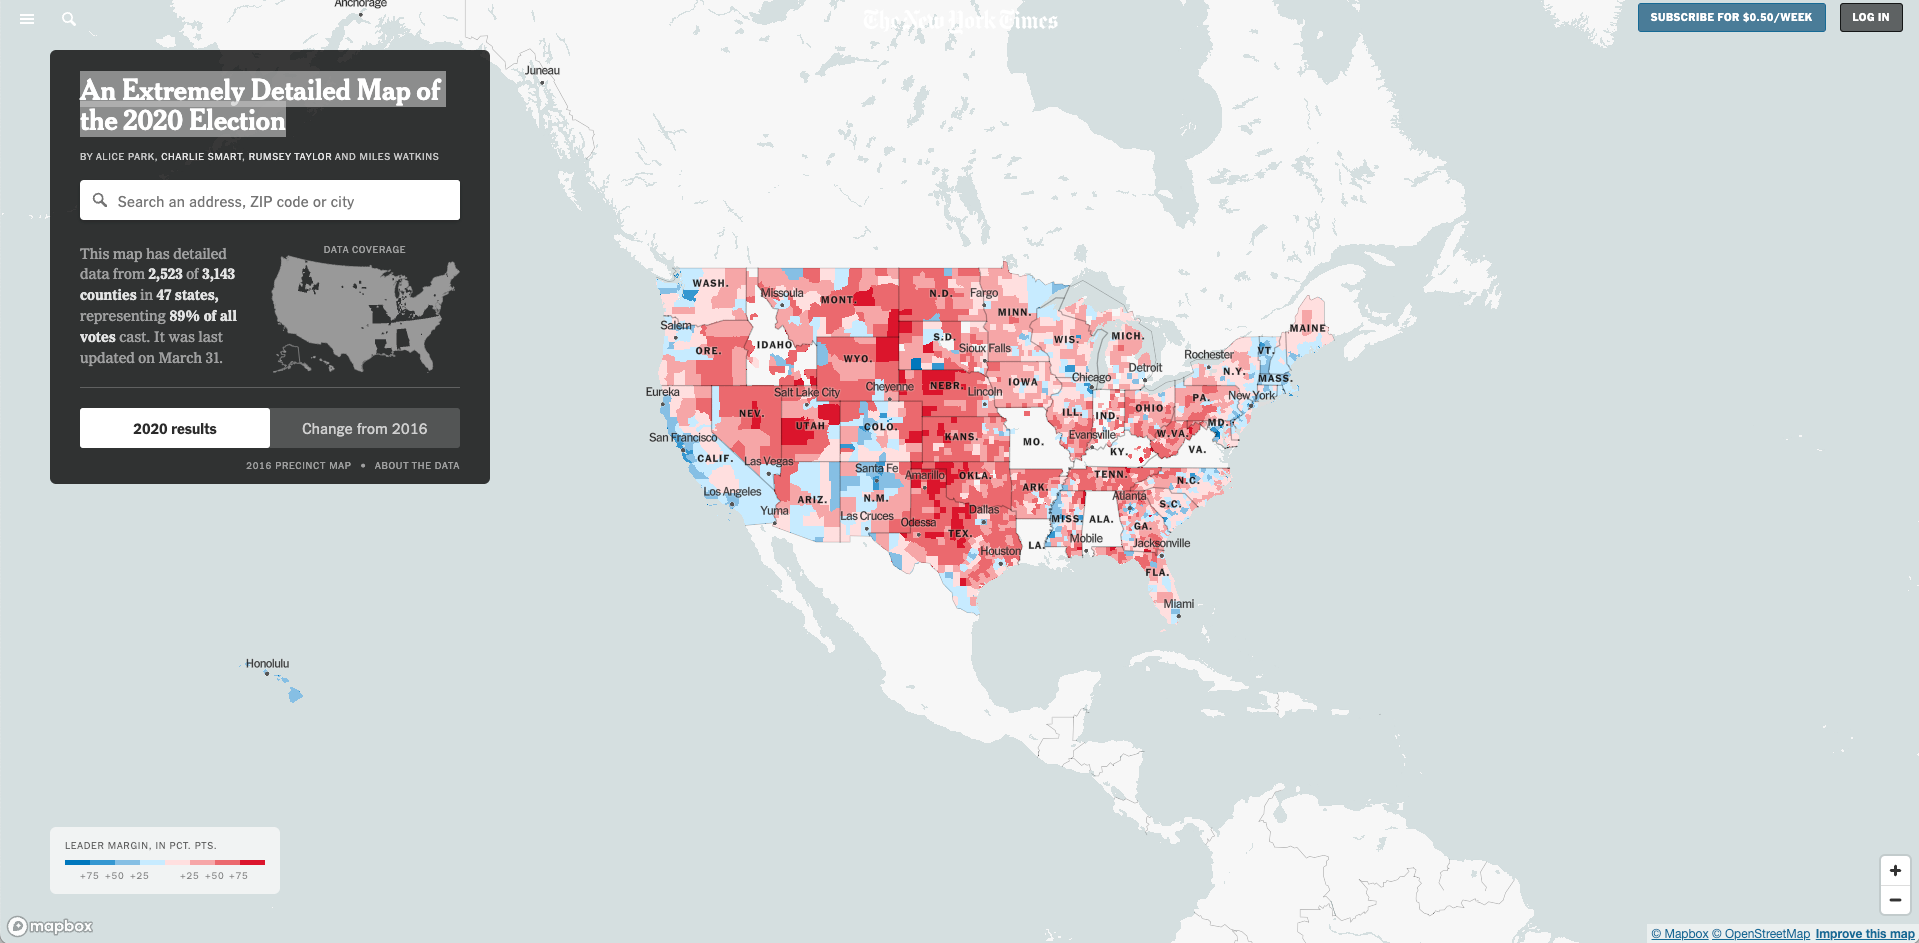
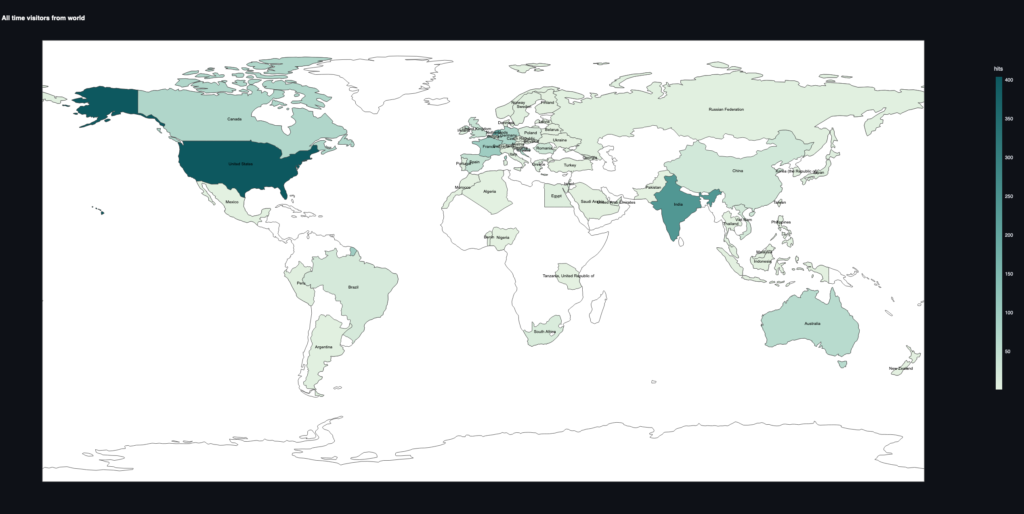
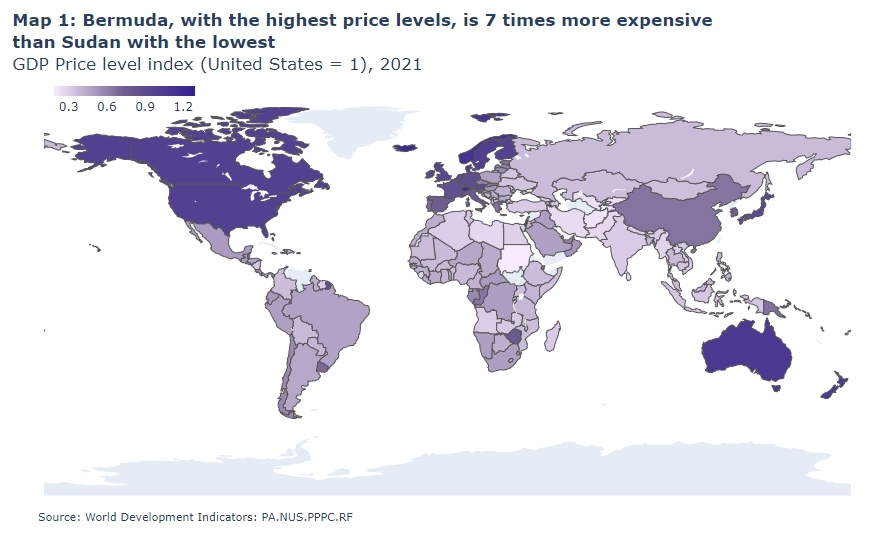
A map chart is a visual representation of data that uses colors or shading to indicate different levels or values...
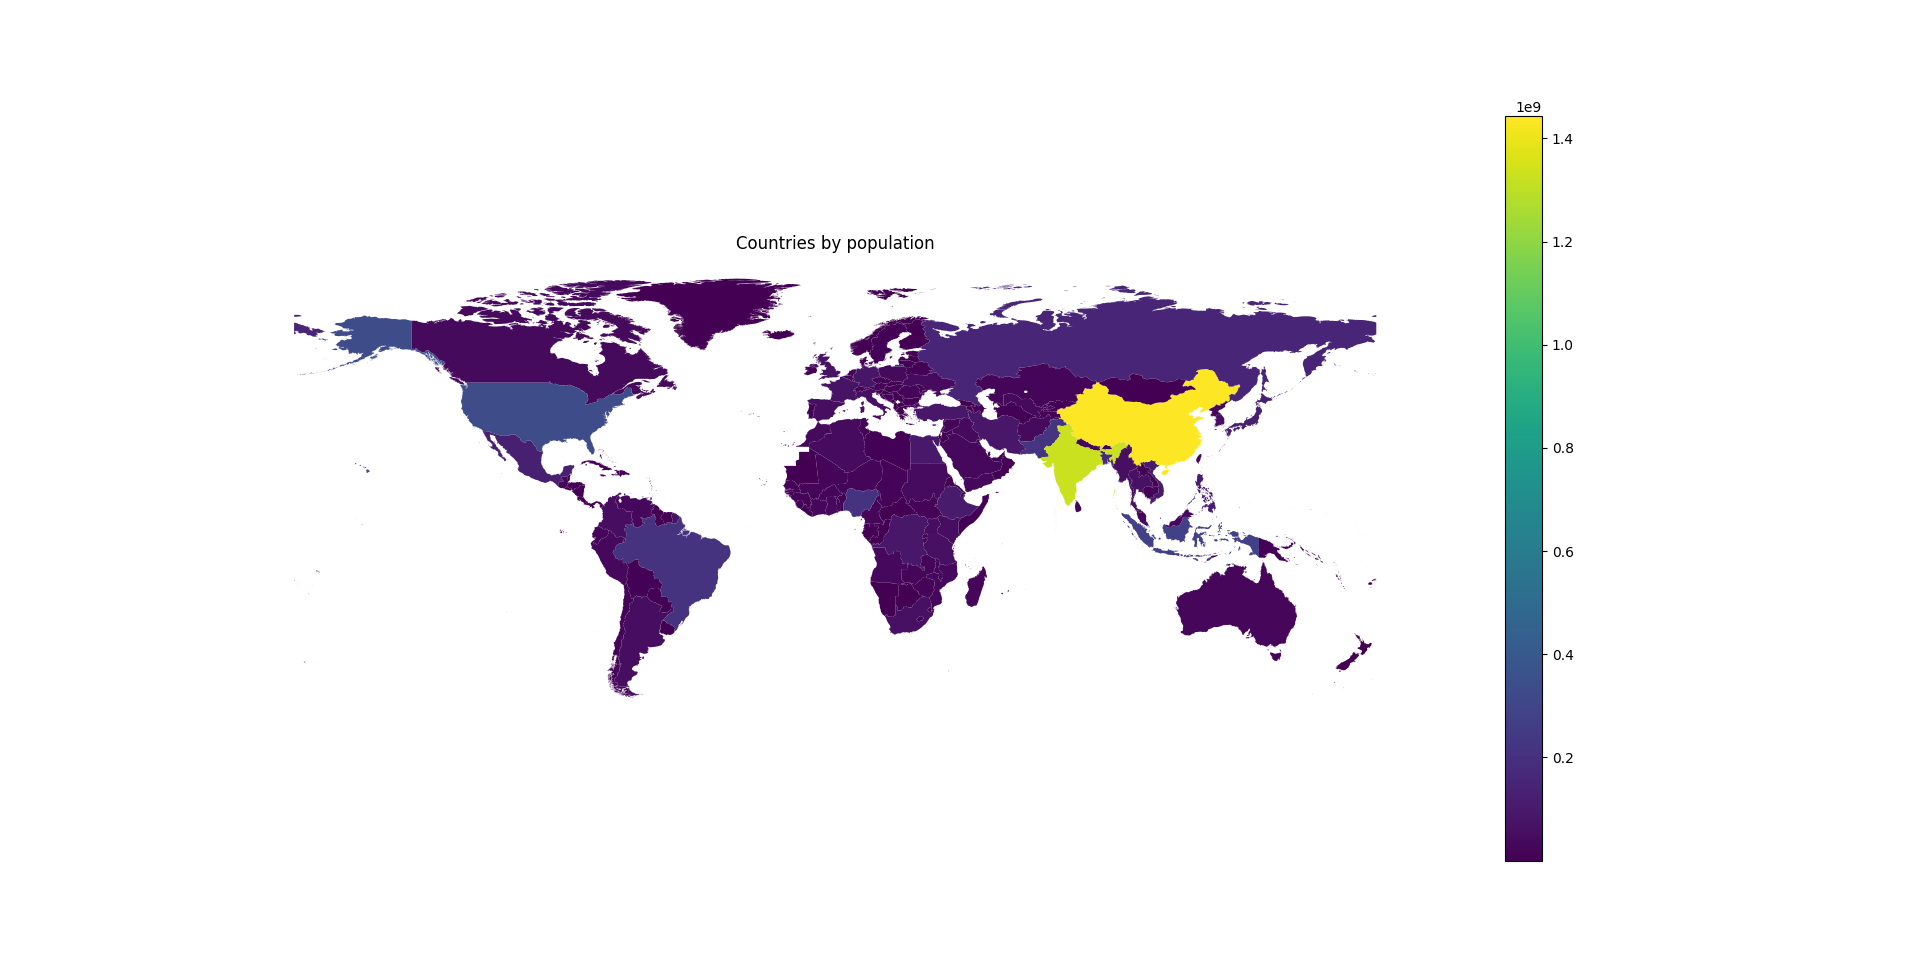
Visualization of the world by populationContinue reading on Medium »
Prompt engineering interactive Python data visualizationsContinue reading on Medium »
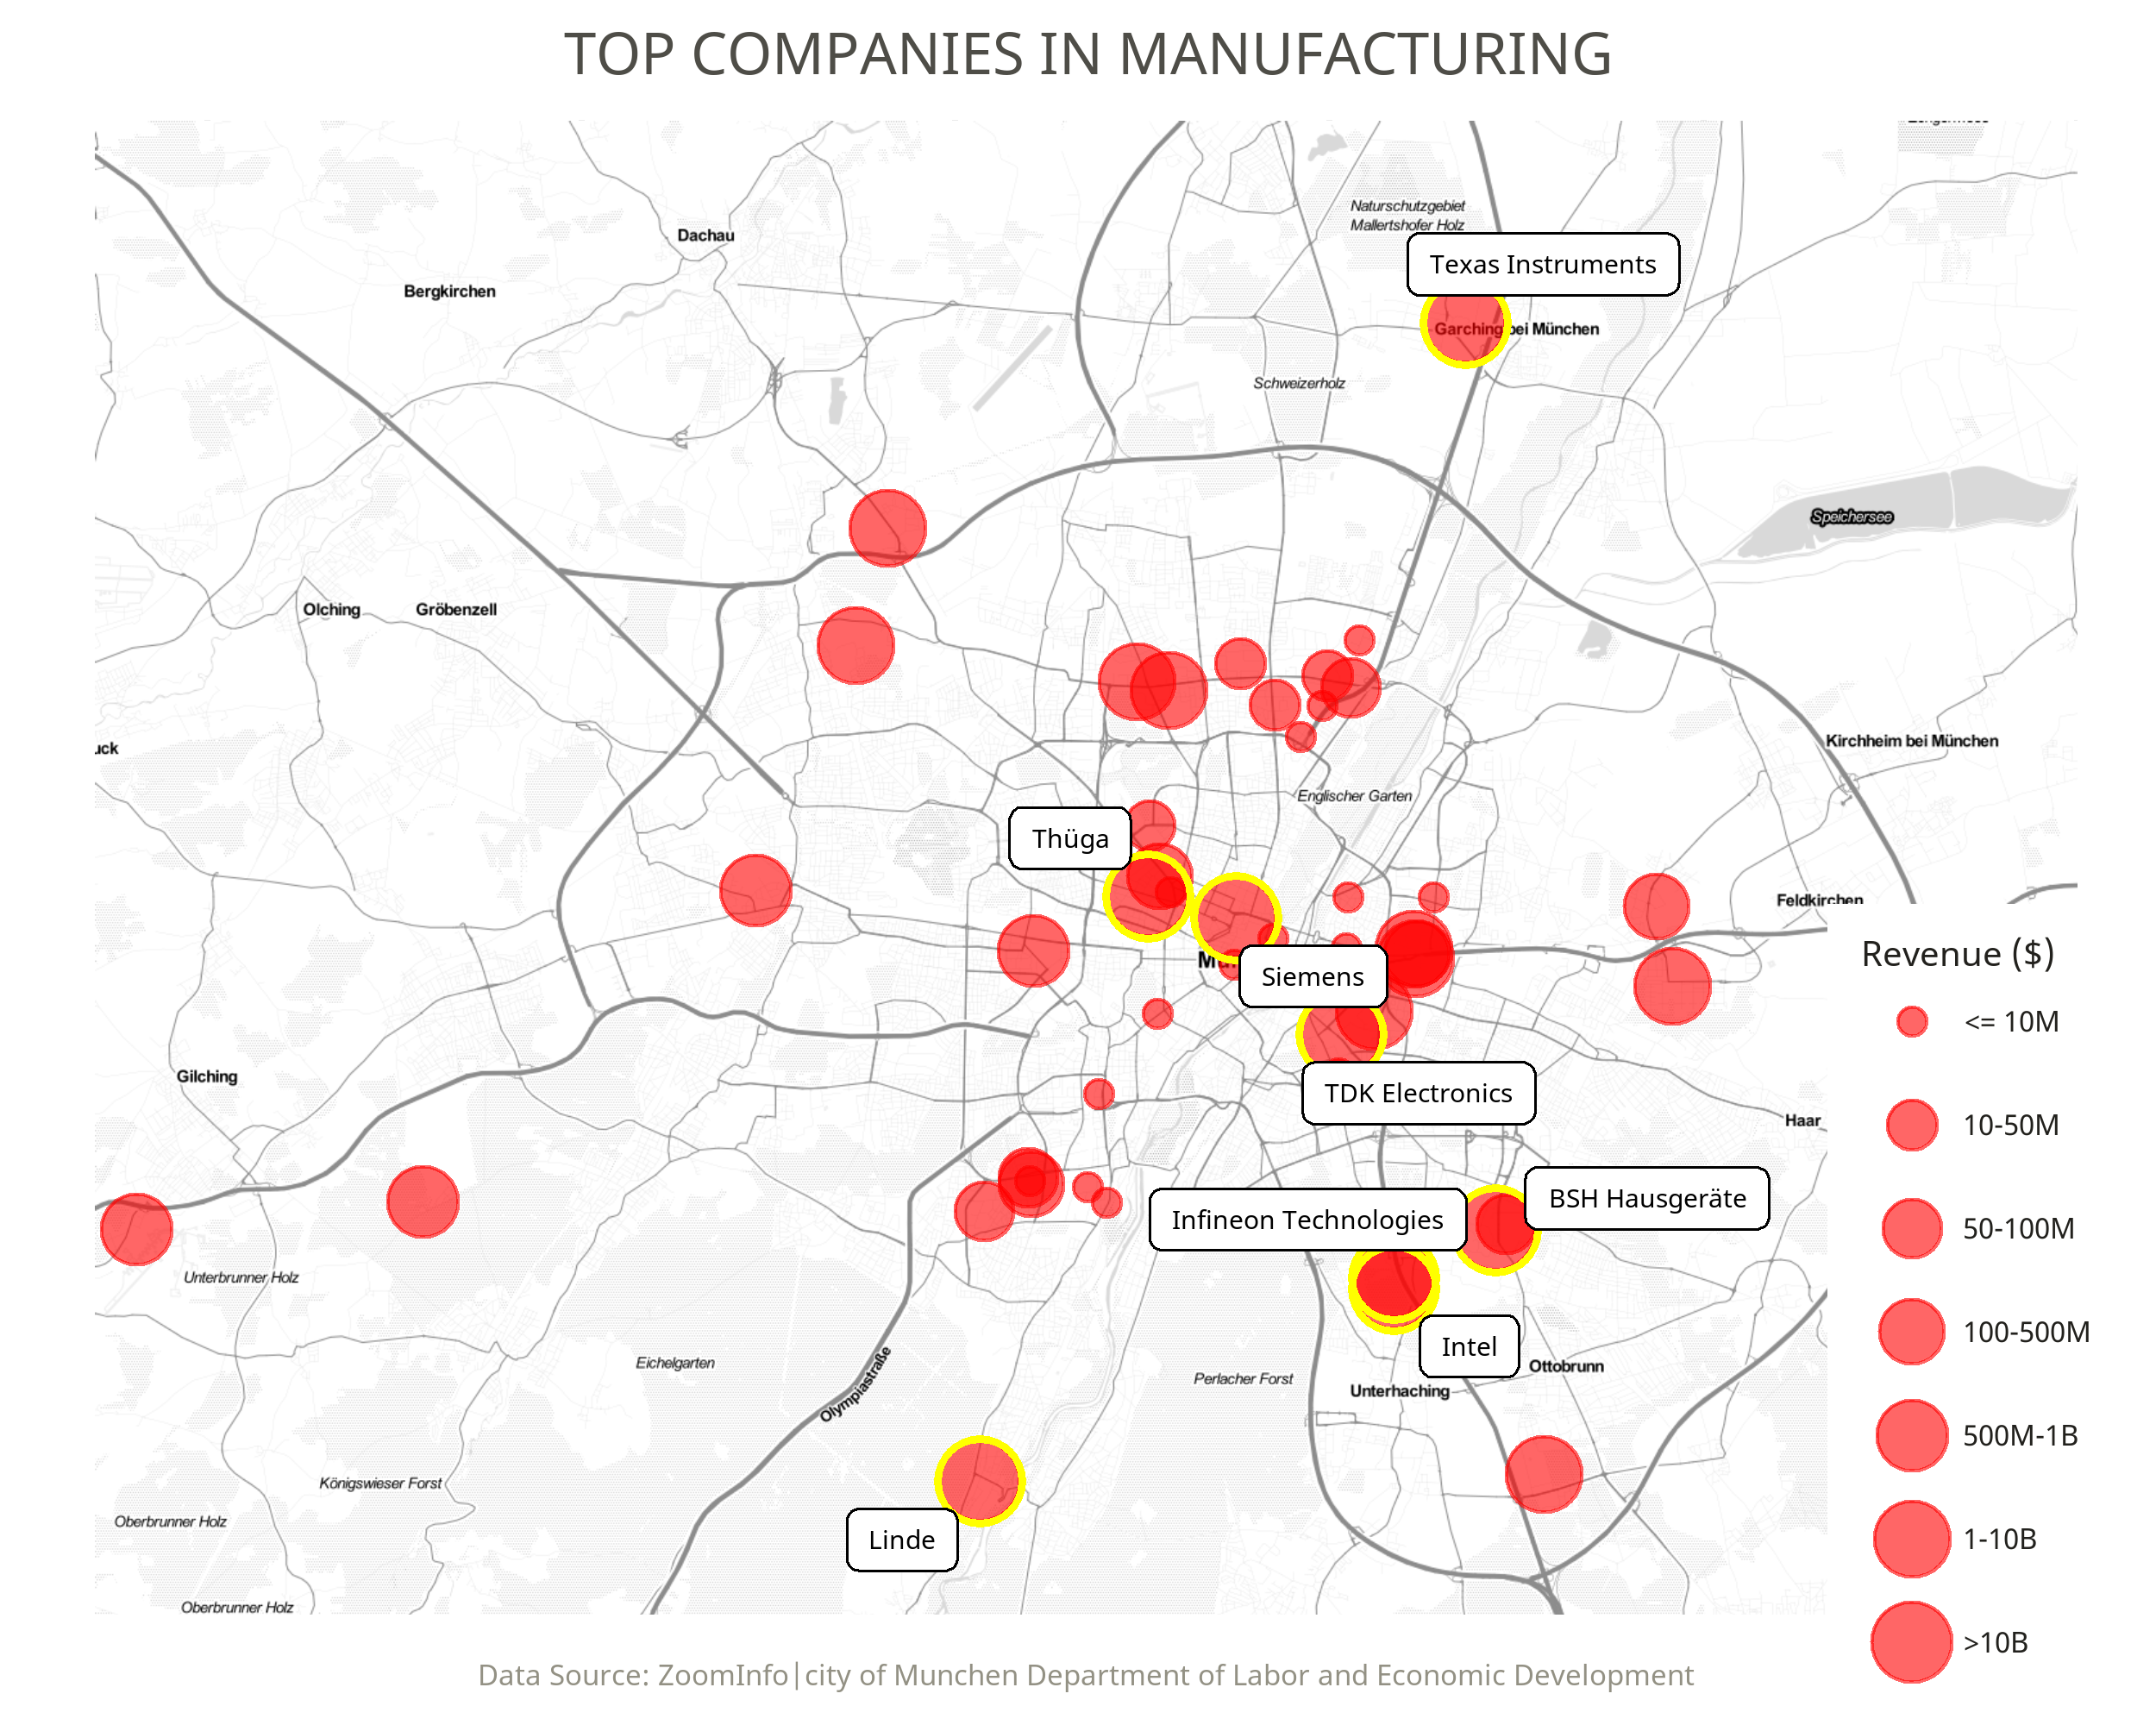
In many business reports, a clear map visualization is required to support illustrating the information such as How are the...
This article offers a detailed instruction on how to use Python programming to create a shots map for football. The...
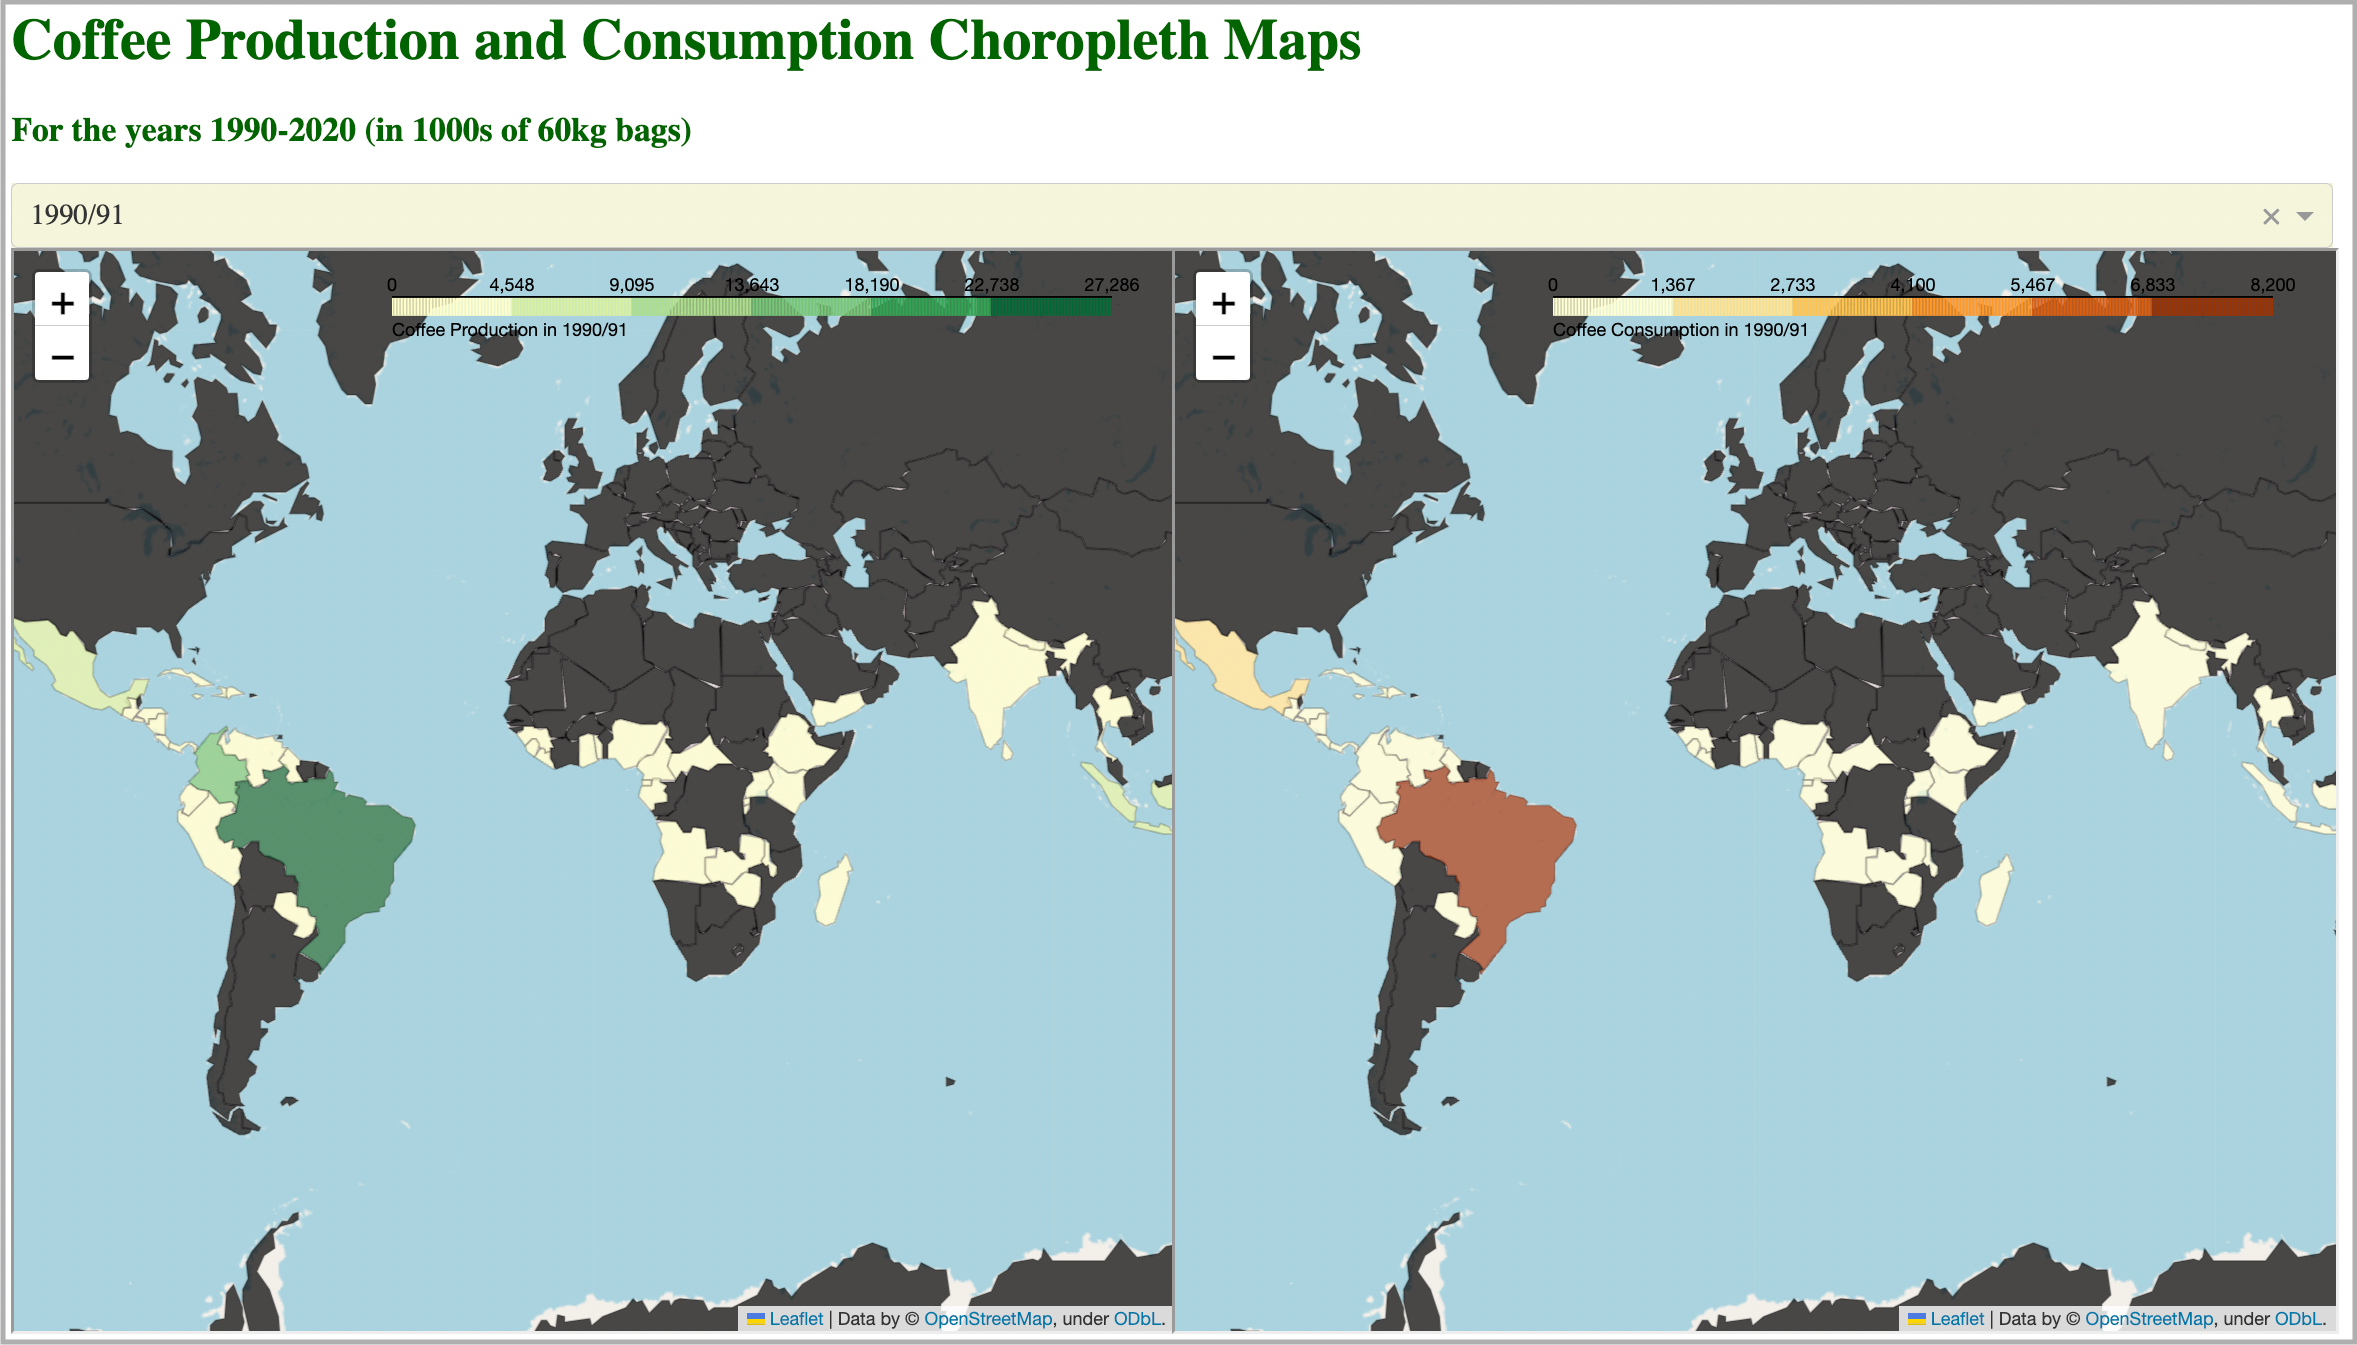
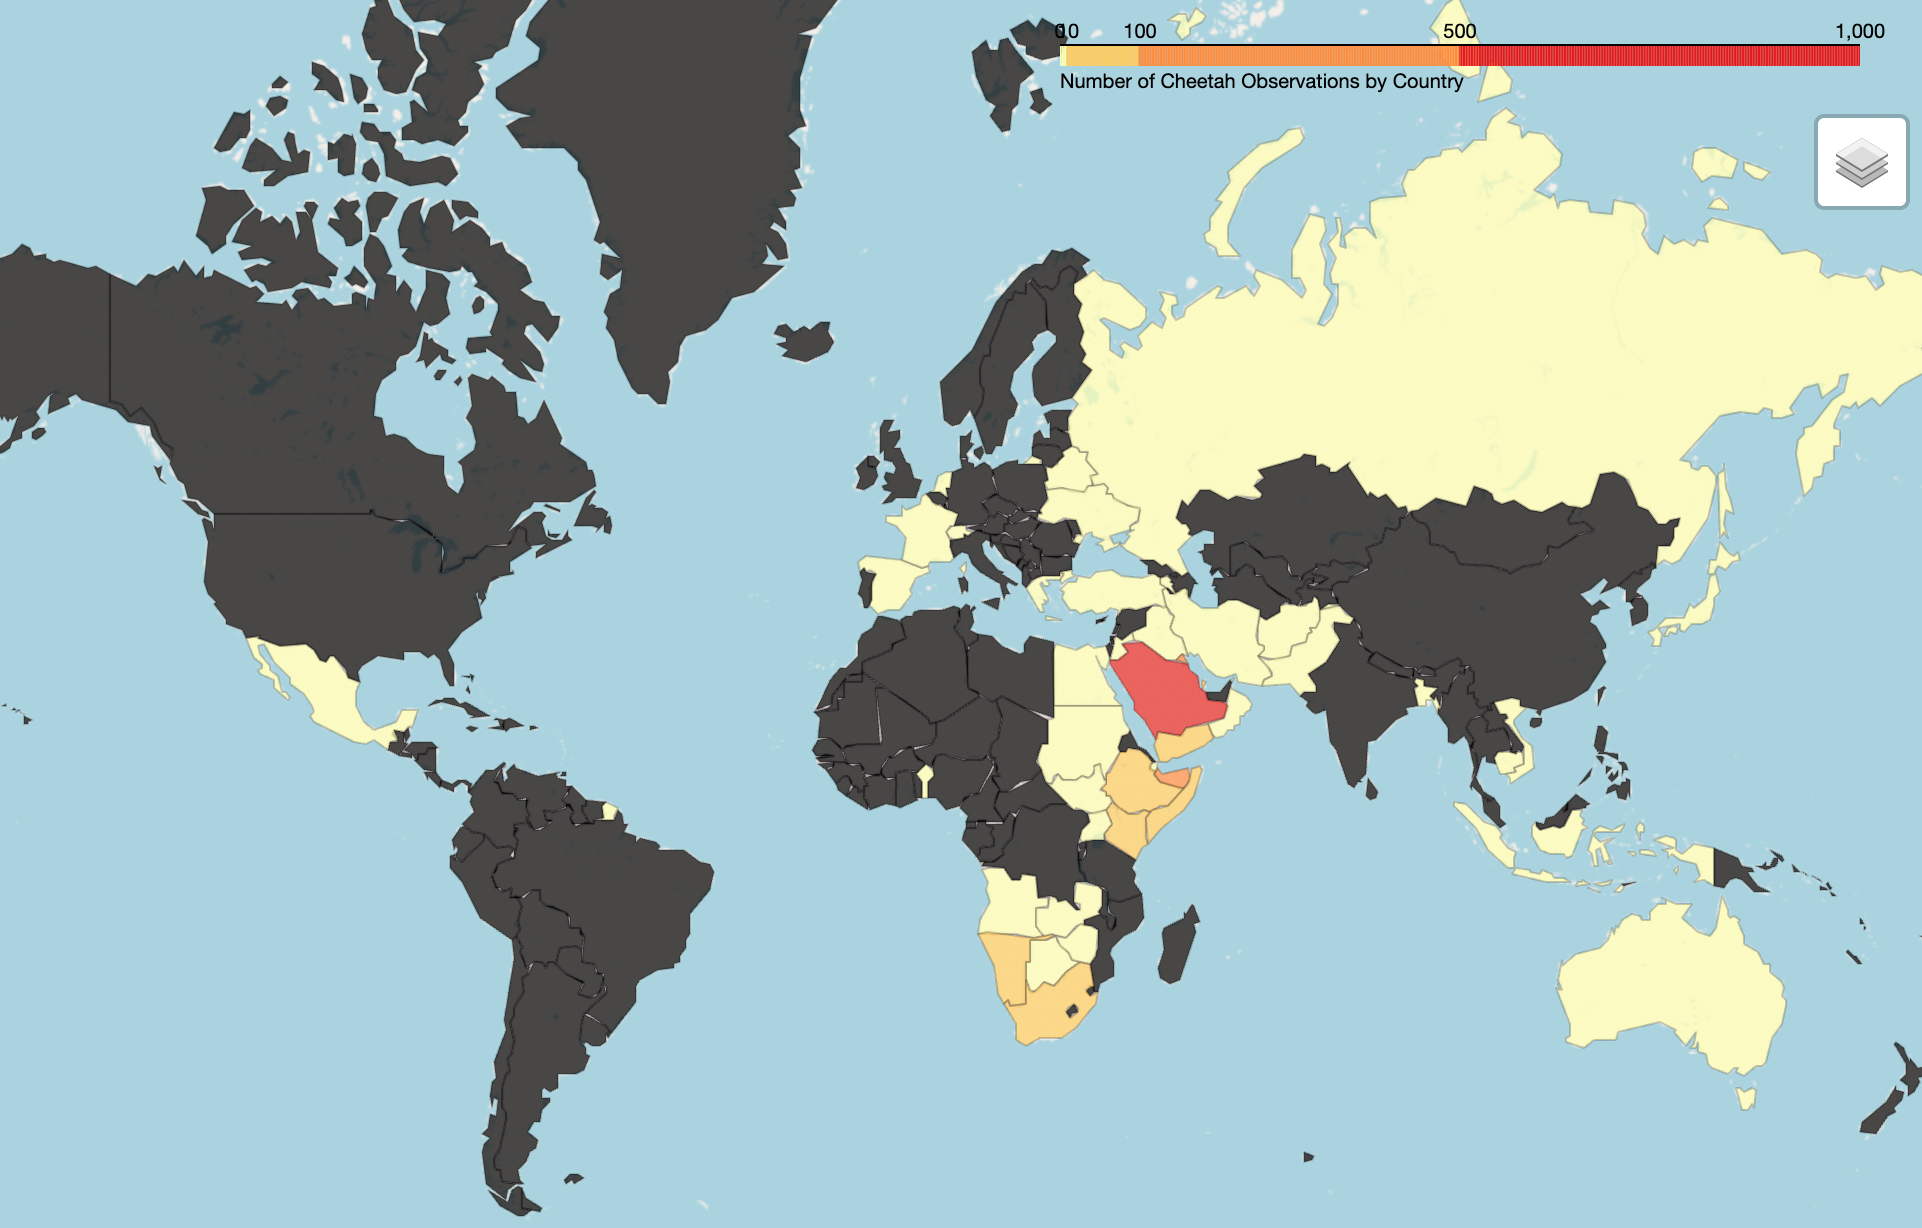
OK, the ease with which ChatGPT can create cloropleth and heatmaps from a dataset is just shocking — IF you know which...
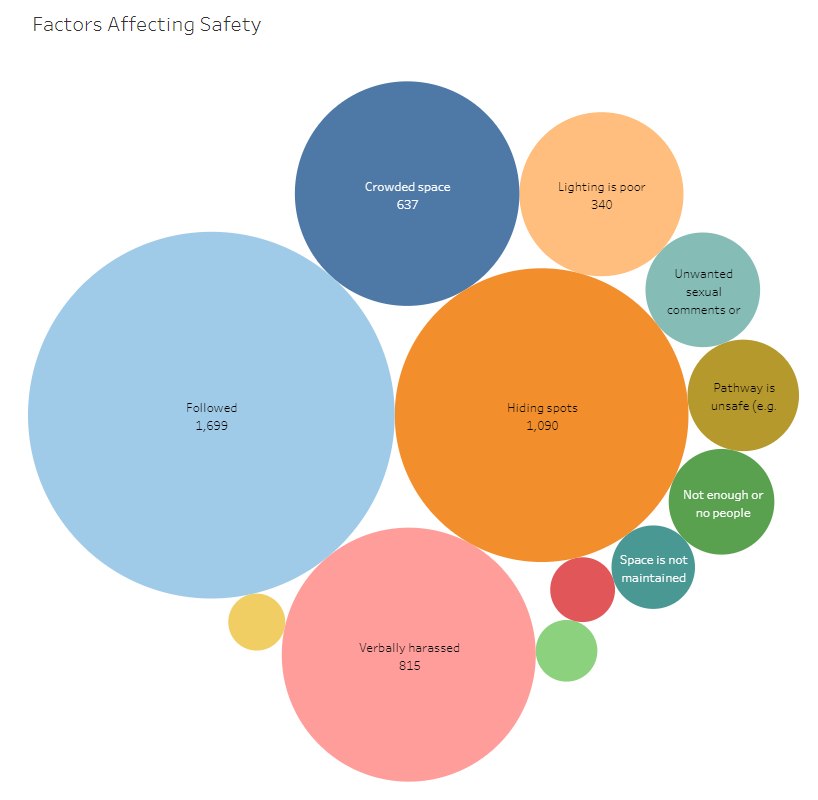
Creating a safe and inclusive environment is crucial for cities to thrive. Analyzing safety perceptions can help us understand which...
BackgroundContinue reading on Medium »
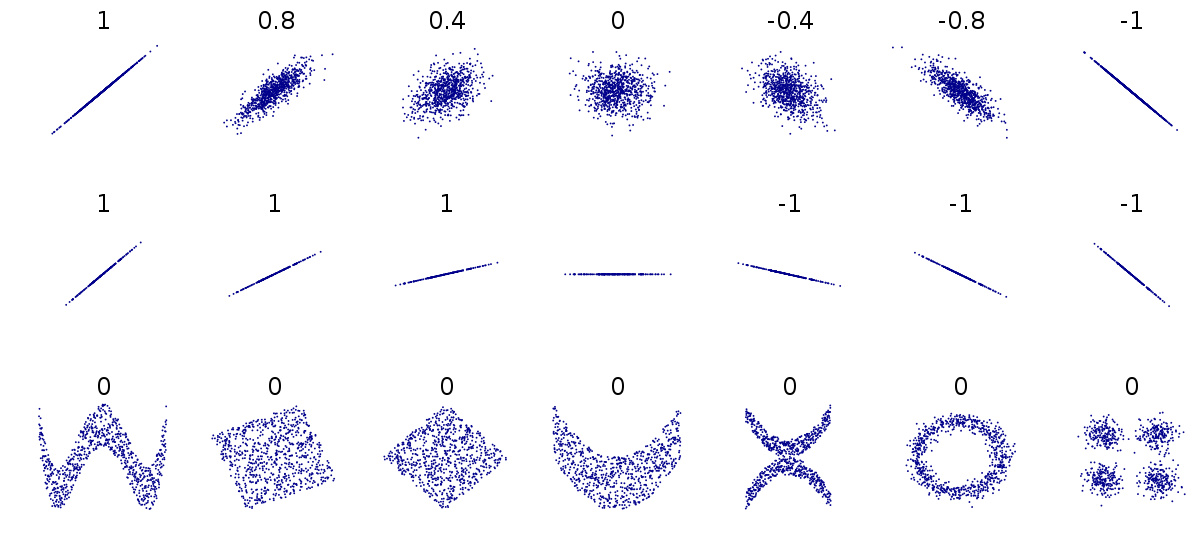
“When performing EDA on a dataset, it is important to visualize correlations. Scatter matrix and heat maps are two of...
Used the “Criminal Location Tracking” dataset to plot and find where the two suspects met based on the coordinates.Continue reading...
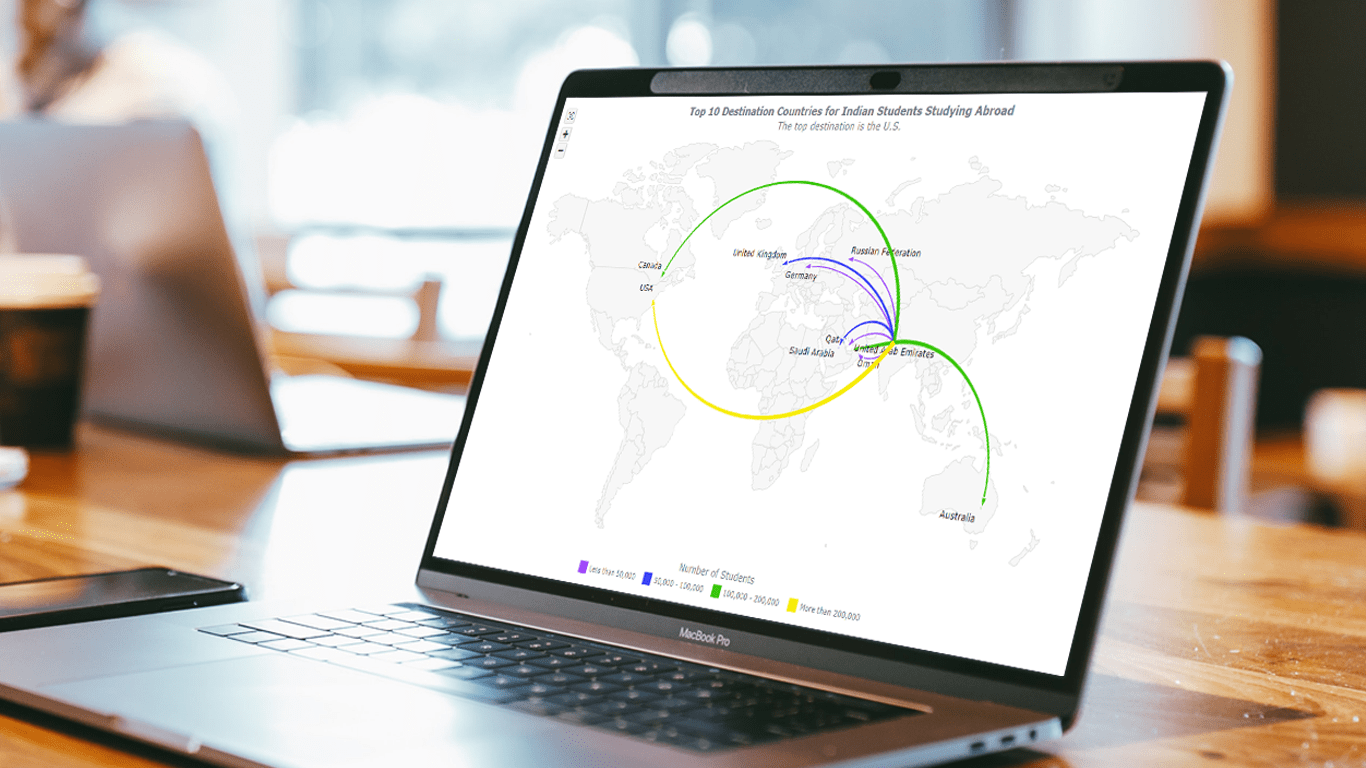
Learn how to create an interactive flow map using JavaScript. Follow this tutorial, visualizing top destination countries for India…Continue reading...
A Geopandas data frame is the Python data structure of choice to perform vector analysis. A Geopandas is basically the...
What would be the role of globalization without a map to wonder your eyes on different statistics? Some time ago...
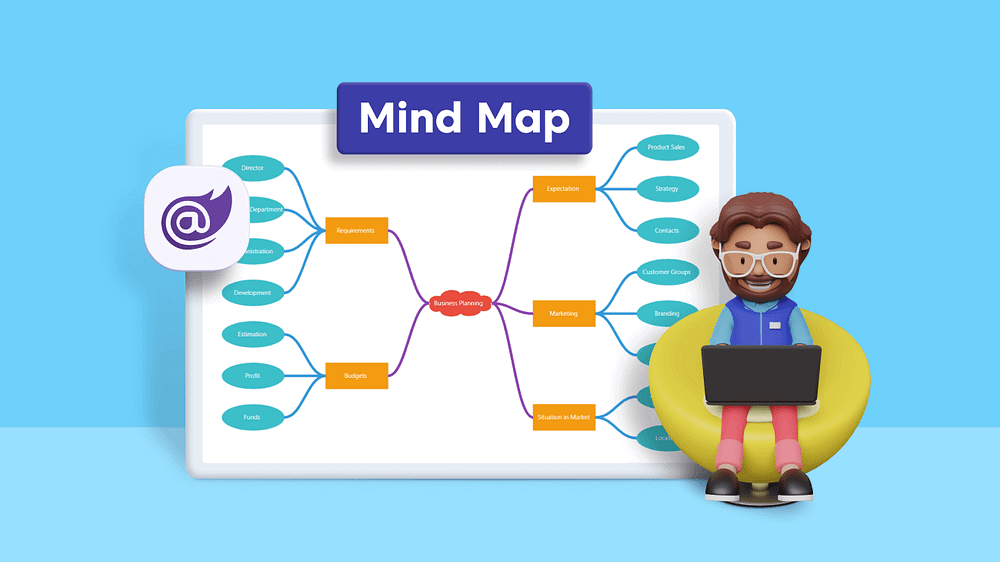
This article demonstrates how to create a mind map using the Syncfusion Blazor Diagram component with code examples.Continue reading on...
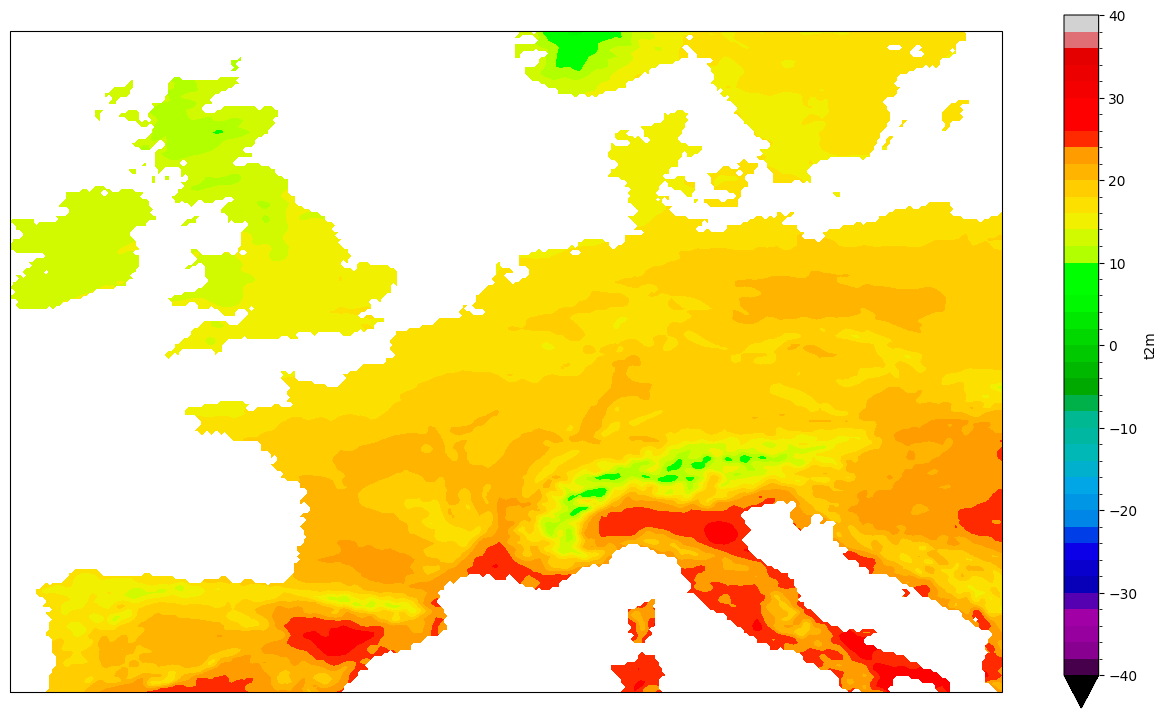
During visualisation of climate data using Python and Cartopy, I encountered term called cyclic point. You may have not heard...
This is the second article in my series on creating charts in Python and sharing them with others. For this...

