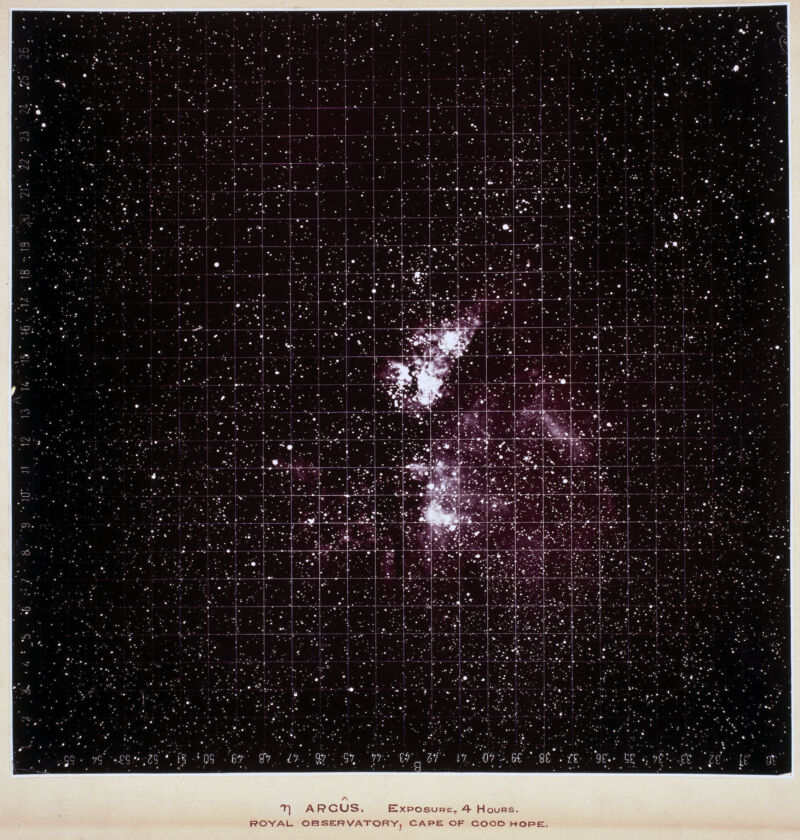

Enlarge / Photograph showing the emission nebula, Eta Carina (formerly Eta Argus) taken using the astrographic telescope at the Royal Observatory, Cape of Good Hope, South Africa. Located at the center of this intricate nebula is a massive but unstable star that one day will explode spectacularly. (credit: SSPL/Getty Images)
Recently, the European Space Agency released the third installment of data from the Gaia satellite, a public catalog that provides the positions and velocities of over a billion stars. This is our most recent attempt to answer some of the most long-standing questions in astronomy: How are stars (and nebulae) spread out across the sky? How many of them are there, how far away are they, and how bright are they? Do they change in position or brightness? Are there new classes of objects that are unknown to science?
For centuries, astronomers have tried to answer these questions, and that work has been laborious and time-consuming. It wasn’t always easy to record what you could see in your telescope lens—if you were lucky enough to have a telescope at all.
Now imagine the emergence of a new technique that, for its time, offered some of the benefits of the technology that enabled the Gaia catalogs. It could automatically and impartially record what you see, and anyone could use it.
Read 34 remaining paragraphs | Comments


More Stories
Will County, Illinois 1864 Map – May 20, 2023 at 04:14AM
This kid on Google Map trying to get by – April 27, 2023 at 05:05PM
World of Hyatt: Complete list of all-inclusive properties in Europe (with map) – April 27, 2023 at 04:57PM