
Share this:

Announcing #30DayMapChallenge in November 2019! Create a map each day of the month with the following themes 🌍🌎🌏No restriction on tools. All maps should be created by you. Doing less than 30 maps is fine. #gischat #geography #cartography #dataviz pic.twitter.com/6Go4VFWcJB
— Topi Tjukanov (@tjukanov) October 25, 2019
I did not take the time to participate but was amazed at the people who did, many of them every day-and some of the results are pretty fantastic. I will highlight some of the ones I liked (mostly showing the tweets) though I did not see everything that came along.
For example, here is Lego Oaxaca.
Día 28: Divertido / #YïkxekpUn mapa de las #naciones de #Oaxaca en estilo #Lego#30daymapchallenge pic.twitter.com/atCYy1lWrQ
— Colmix (@Colmixe) November 29, 2019
Mangroves vs Hurricanes
#30DayMapChallenge Day 25: Climate – Mangroves vs Hurricanes
Mangroves have the ability to lessen the impact of flooding caused by hurricanes (reducing storm surges by 26-76%) BUT they are in an annual decline globally. pic.twitter.com/zH2nsElrFS— Christopher Pollard (@CRVanPollard) November 25, 2019
European Hydrology
#30DayMapChallenge nr 26 (hydrology): Where each drop of rain in Europe (EU, actually) flows to pic.twitter.com/8iJ9krRRtE— Maarten Lambrechts (@maartenzam) November 26, 2019
More from Maarten Lambrechts here.
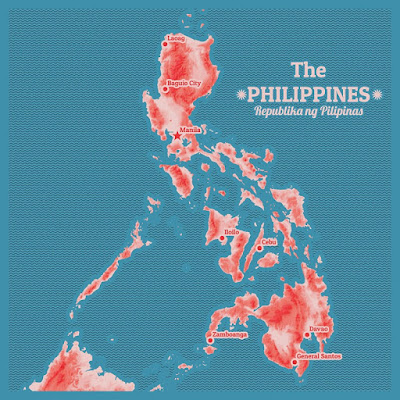
Here is elevation data from the Philippines from Carl Churchill-his other work can be seen on his Flickr album.

New York CityBike data as animated hexagons-press play.
#30DayMapChallenge Day 4: HexagonsCitibike trip data binned into hex pillars by finish position and pivoted into hourly blocks by stop time for New York.
Data via: https://t.co/OFuEtfnixP#map #3d #dataviz #nyc pic.twitter.com/tAnVDy1s5r
— Craig Taylor (@CraigTaylorGIS) November 4, 2019
Commuter Rail in the Northeasten USA
My submission for #30DayMapChallenge day 2 – lines:
Commuter rail (not Amtrak) in northeastern US. Some data was hard to find (esp @MTA). I’ve taken these lines from Wilmington DE to New Haven CT. Shows how challenging #railroad is in US. #Map produced in #QGIS 3.8. pic.twitter.com/HKgzCUYRr8— Philip Pierdomenico (@PhilPierdo) November 2, 2019
London Fried Chicken Territories
London chicken territories, based on purveyors of fried chicken. #30DayMapChallenge #Day28 #Funny pic.twitter.com/DJZxBOqHrE— Heikki Vesanto (@HeikkiVesanto) November 28, 2019
and whatever this is.
— emil (@57×025) November 28, 2019
For more here is a huge gallery of submissions.


More Stories
Will County, Illinois 1864 Map – May 20, 2023 at 04:14AM
This kid on Google Map trying to get by – April 27, 2023 at 05:05PM
World of Hyatt: Complete list of all-inclusive properties in Europe (with map) – April 27, 2023 at 04:57PM